 Add to Chrome
Free Engagement Rate Calculator for Instagram, TikTok, Facebook and X, With Benchmarks
Engagement rate is a post's interactions divided by followers, times 100. Check an Instagram or TikTok profile, or type in one post on any of the four platforms, and see it graded against that platform's own 2025 average.

Built and checked by Simon Beno, Co-founder, CEO & CMO, Selzee. Last checked October 2026.
What the averages here come from
Socialinsider 2026 Social Media Benchmarks the four averages by followers, which interactions each counts, and the average likes, comments and shares per post behind the next-post tip. A third party: the platforms publish no averages.
Socialinsider 2026 TikTok Benchmarks the TikTok average by views and its follower bands.
Socialinsider 2026 Instagram Benchmarks the Instagram rates for Reels, carousels and images.
Profile figures come from the account's public posts at the moment of the check and are kept for 24 hours. The worked examples on this page were made by the same arithmetic the tool runs.
The short answer
- Engagement rate = interactions / followers × 100, and each platform's published average counts different interactions.
- The 2025 averages by followers: TikTok 3.70%, Instagram 0.48%, Facebook 0.15%, X 0.12% (Socialinsider). TikTok by views: 4.20%.
- One target across platforms fails: a 0.50% post is average on Instagram, below average on TikTok, and double the average on Facebook and X.
Our articles are still written by HUMANS! Get human written articles in your Google feed.
Add as preferred sourceAverage engagement rate by platform (2025)
Socialinsider's averages for brand accounts, from 70 million posts published between January 2024 and December 2025 (source). Each platform counts different interactions, and the calculator above counts the same ones.
| Platform | Average by followers | What it counts | By views |
|---|---|---|---|
| TikTok | 3.70% | Likes, comments, shares and saves | 4.20% |
| 0.48% | Likes and comments | Not published | |
| 0.15% | Reactions, comments and shares | Not published | |
| X | 0.12% | Likes and reposts | Not published |
Rival IQ counts every interaction and reports a lower Instagram median; our Instagram engagement rate calculator grades against that one.
TikTok engagement rate by views, by account size
On TikTok the grade by views is set by follower count (Socialinsider, 2025). Our TikTok engagement rate calculator goes deeper on views.
| Followers | Average by views |
|---|---|
| 1K to 5K | 4.40% |
| 5K to 10K | 4.00% |
| 10K to 50K | 3.90% |
| 50K to 100K | 3.75% |
| 100K to 1M | 3.95% |
Under 1K or over 1M followers, the tool uses the overall 4.20%.
Is my engagement rate good?
By followers, a rate below the platform's average is below average, from the average up to twice it is average, and twice the average or more is double.
| Platform | Below average | Average | Double the average |
|---|---|---|---|
| Under 0.48% | 0.48% to 0.95% | 0.96% or more | |
| TikTok | Under 3.70% | 3.70% to 7.39% | 7.40% or more |
| Under 0.15% | 0.15% to 0.29% | 0.30% or more | |
| X | Under 0.12% | 0.12% to 0.23% | 0.24% or more |
What 12% or 10% means
So a 12% engagement rate by followers is double the average on all four platforms, and 10% on Facebook is over 60 times its 0.15% average. At that level, check it was worked out by followers and not by reach or views, and that the account is not a small one where friends do most of the liking.
Posts that grade above average start with one clear idea
Example posts Selzee made for brands. Each one leads with a single idea a reader can react to.
MBoo
A sock ad that shows the product on the trail with one line of copy.
GymBeam
A protein drink ad built on one word, Easy, over a kitchen scene.
Elysé
A baby carrier ad with a one-line promise: move more freely with baby close.
SUN
A podcast app ad that pictures the moment of use: learn on your commute.
How to calculate engagement rate
Engagement rate is interactions divided by followers, times 100. The division never changes. What changes is which interactions count, and the calculator counts what each platform's average counts. The same steps hold if you searched for the engagement rate formula.
-
Instagram
(likes + comments) / followers × 100. 138 likes and 21 comments on 4,200 followers: 159 / 4,200 = 3.79%.
-
TikTok
(likes + comments + shares + saves) / followers × 100. By views, divide by the video's views instead.
-
Facebook
(reactions + comments + shares) / fans × 100.
-
X
(likes + reposts) / followers × 100. Replies are not in the average, so they are not in the grade.
One rate, four verdicts
One rate, four verdicts: 0.50% is average on Instagram, below average on TikTok, and double the average on Facebook and on X.
A profile check works the same way post by post. Each of the last 12 posts gets its own rate, the account's rate is the mean of those rates, because Socialinsider's figure is an average rate per post, and the median sits beside it as a check. For X on its own, our X engagement rate calculator covers impressions in more depth.
Where to find these numbers
-
Instagram
Open the post and tap View insights. Likes, comments, shares and accounts reached sit together.
-
TikTok
Open the video, tap the three dots, then Analytics. Views, likes, comments, shares and saves are listed.
-
Facebook
In Meta Business Suite, open Content and pick the post. Reactions, comments, shares and reach sit on its insights.
-
X
Open the post and tap the analytics icon. Likes, reposts, replies and impressions are listed.
How to read your rate properly
-
Pick the platform before you read the number
The same 1% is a failing TikTok rate and a strong Instagram one. A rate with no platform attached is not a measurement.
-
Take every figure from the same post
Followers today against likes from a post six months ago is a different account. Read all of it off one screen.
-
Count what the benchmark counts, then never change it
The calculator uses each platform's own set. Switching sets mid-year gives a trend line that measures your formula, not your posts.
-
Compare formats against each other, not against the account
A carousel and a video reach different people. Averaging them hides the format that is working.
What moves the rate in your next post
After a grade, the calculator gives one tip. Below the average, it compares the post's comments and shares per 100 likes with the average brand post on that platform (Socialinsider, 2025) and names the weaker one. At or above the average, it points at the post to repeat.
The four tips
Few comments
End the next post on a question people can answer in a word. The average Instagram post earns about 6.0 comments per 100 likes.
Few shares
Make something people would send to a friend: a list, a how-to or a strong take. The average Instagram post earns about 13.4 shares per 100 likes.
Both normal
The people who saw it reacted as usual; too few saw it. On Instagram, Reels (0.52%) and carousels (0.55%) beat single images (0.37%).
At or above average
Your best post is the brief for the next one: same format, same kind of opening.
How the tip reads a profile
On a profile check the tip reads the last 12 posts together. On Instagram only comments are compared, because shares are not public. X has no tip from the mix: its averages are too small to compare. For more ideas to test, see our Instagram post ideas; for the paid side, the ROAS calculator and the conversion rate calculator.
Posts that ask for a comment or a share
More example posts Selzee made for brands, each built around the reaction it asks for.
Thrive Market
A grocery ad that opens on a question: tired of inflated grocery prices?
The Point Labs
A post written as a discussion question about a city proposal.
Otherside
A four-panel ad that reads like a carousel, one step per panel.
Finelly
An app ad that shows the moment on the phone: meetups with late fines and clear receipts.
What affects your engagement rate
Two accounts with the same followers can post very different rates. These three things usually explain the gap.
Account size
Rates fall as accounts grow. On TikTok, by views: 4.40% at 1K to 5K followers, 3.75% at 50K to 100K.
Post format
On Instagram, carousels average 0.55%, Reels 0.52% and single images 0.37%.
Bought followers or likes
Fake followers pull the rate down and bought likes push it up. A rate far off the average is worth a closer look.
Engagement rate calculator: FAQ
What is a good engagement rate?
How do you calculate engagement rate?
Is a 12% engagement rate good?
Is 10% engagement on Facebook good?
How do I find my Instagram engagement rate?
Should I calculate engagement rate by followers or by reach?
Why do engagement rate benchmarks disagree?
What happens to the data when I check a profile?
Can I check someone else's engagement rate?
Why can't the calculator read my account?
How we checked
- The averages are Socialinsider's 2026 benchmark studies, read at the source on 19 October 2026: 70 million posts from January 2024 to December 2025 (all platforms), and the TikTok and Instagram studies for views, account size and format.
- The calculator counts the same interactions each average counts, per platform.
- A profile check reads the account's last 12 public posts, leaves out pinned posts and posts with hidden likes, and needs at least 3. The grade is the mean of the per-post rates, with the median beside it. Results are kept for 24 hours.
- It does not grade the reach rate outside TikTok, where no current third-party average by reach exists, and it cannot read private accounts or Facebook and X profiles.
- Every worked example on this page was done by hand and checked against the tool.
- Last checked: 19 October 2026.
Beat your platform's average with posts that already work.
The calculator shows where a post stands. Selzee finds the posts and ads going viral for other brands right now and recreates them for yours, new ones every day, ready to ship to Instagram, Facebook and TikTok in 1 click.
Get started for freeKeep exploring
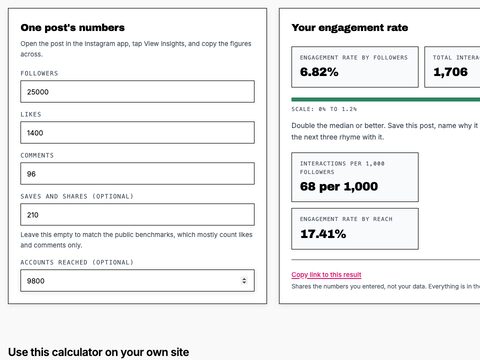
Calculate your Instagram engagement rate by followers and by reach, graded against the published all-industry median.
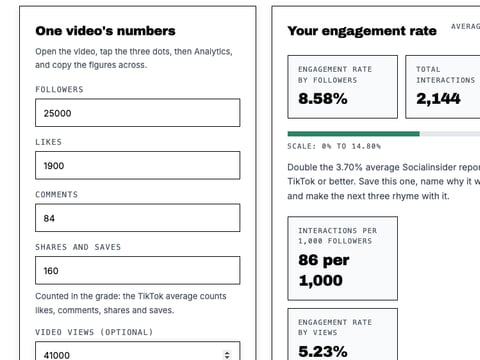
Calculate your TikTok engagement rate by followers and by views, graded against the published average.
Calculate your Facebook engagement rate by fans and by reach, graded against the published average.
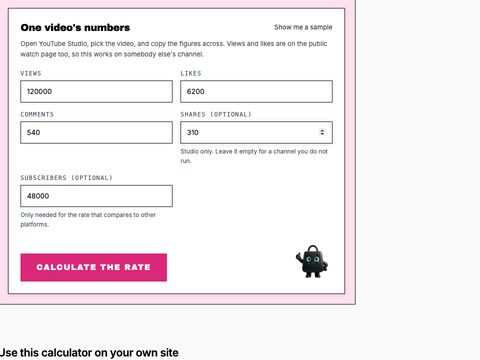
Calculate a YouTube engagement rate by views and by subscribers, with the interactions per 1,000 views and the comment share.