 Add to Chrome

Facebook Engagement Rate Calculator (FREE TOOL)
Your Facebook engagement rate is the share of your page fans who interact with a post: interactions divided by fans, times 100. Enter one post and see how it grades against the real Facebook average.

engagement rate by fans
The short answer
- A good Facebook engagement rate is about 0.15% by followers, the 2026 average across 130,683 business pages. 0.30% is double it.
- The formula: (reactions + comments + shares) / fans × 100.
- Divide by fans to compare your page with others. Divide by reach to judge one post.
Our articles are still written by HUMANS! Get human written articles in your Google feed.
Add as preferred sourceWhat counts as a good Facebook engagement rate
The honest answer is much lower than the number most pages are chasing. Socialinsider put the average Facebook engagement rate at 0.15% in its 2026 benchmarks, from 25 million posts across 130,683 business pages collected between January 2024 and December 2025. That is the figure the bands in this calculator are built on. It also reports the number as flat year over year, which makes Facebook the steadiest platform in the study while Instagram fell 24%.
Put that in whole numbers, because the percentage hides it: on a 45,000 fan page, an average post earns about 68 interactions. Not 680. Pages rewrite their entire content strategy every quarter chasing a rate that organic distribution on Facebook has not supported for years. If you also run Instagram or TikTok, the multi-platform engagement rate calculator grades each against its own average instead of one blended target.
- TikTok 3.70%
- Instagram 0.48%
- Facebook 0.15%
- X 0.12%
How to calculate Facebook engagement rate
Facebook engagement rate = (reactions + comments + shares) / fans × 100. The same formula holds if you searched for the Facebook engagement rate formula.
Worked example: a post on a 45,000 fan page gets 62 reactions, 11 comments and 9 shares. That is 82 interactions. 82 / 45,000 × 100 = 0.18%, just above the Facebook average. The same post reached 4,000 people, so by reach it is 82 / 4,000 × 100 = 2.05%.
The arithmetic is trivial. The argument is about what goes under the line. Published benchmarks divide by fans, because that is the only figure an outside analyst can see, which is why this calculator grades against fans by default. Dividing by reach grades the post on the people who actually saw it. Divide by fans when you want to know how you compare to other pages. Divide by reach when you want to know whether the post was any good. What you cannot do is switch between them across a year and call the resulting line a trend.
Where to find these numbers in Meta Business Suite
-
Open Content
In Meta Business Suite, open Content and pick the post.
-
Read the four figures
Reactions, comments, shares and reach sit together on the post's insights.
-
Copy them across
Type them into the calculator above, all from the same post.
What this calculator gives you
A percentage on its own does not tell you what to post next. These four outputs do.
Graded against the real average
Facebook benchmarks are far lower than people assume. The verdict tells you whether 0.2% is a problem or a win before you change anything.
By reach as well as by fans
Organic reach on a page is a fraction of the fan count. The reach rate grades the post on the people who actually saw it.
Interactions per 1,000 fans
At a 0.15% average, percentages get hard to feel. "Two per thousand fans" is a number you can hold in your head.
It flags bad inputs
More interactions than accounts reached means the two figures came from different posts. The tool says so instead of grading the mistake.
How to read your rate properly
-
Take every figure from the same post
Fans today against reactions from a post six months ago is a different page. Pick the post and read all of it off one screen.
-
Decide what counts, then never change it
Reactions and comments only, or reactions plus comments plus shares. Switching mid-year makes the trend line measure your formula.
-
Expect a low number and stop reacting to it
A 0.15% average means an ordinary post on a 45,000 fan page earns about 68 interactions.
-
Compare formats against each other
A link post and a native video reach different audiences. Averaging them hides the format that is working.
A flat Facebook rate is usually an audience problem
Most page fan counts were built years ago, often by campaigns that optimised for the like rather than the customer. The rate looks broken because the denominator is full of people who were never going to buy anything, and no amount of posting fixes a mismatched audience.
What moves the rate is posts built for the people you have now. Selzee finds the posts going viral right now, recreates them for your brand, and posts or schedules them to Facebook in 1 click, with new ones every day. For the paid side, pair this with the ROAS calculator and the conversion rate calculator.
Facebook engagement rate calculator: FAQ
What is a good Facebook engagement rate?
How do I calculate Facebook engagement rate?
Why is my Facebook engagement rate so much lower than Instagram?
Should I divide by fans or by reach?
Did Facebook engagement fall again this year?
How do I find my engagement rate in Meta Business Suite?
Does this calculator send my numbers anywhere?
How we checked
- The benchmark is Socialinsider's 2026 study: 25 million Facebook posts from 130,683 business pages, January 2024 to December 2025.
- It counts reactions, comments and shares against fans, and so does the calculator.
- The bands: below 0.15% is below average, 0.15% or more is average, 0.30% or more is double.
- The arithmetic runs in your browser and is checked against hand-worked cases.
- Last checked: 6 September 2026 (benchmark read at the source).
See what is actually driving your Facebook engagement
Measuring the number takes ten seconds. Moving it takes the right posts. Selzee finds what's going viral and makes it for your brand.
Get started for freeKeep exploring
Calculate an engagement rate for Instagram, TikTok, Facebook or X, graded against the published average for that platform.
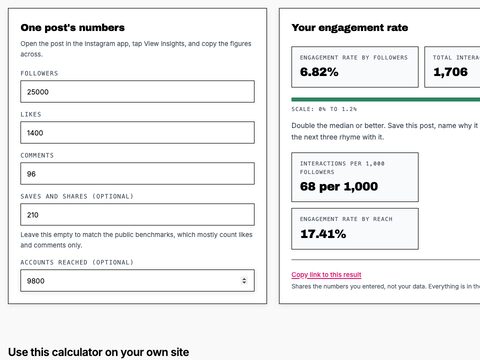
Calculate your Instagram engagement rate by followers and by reach, graded against the published all-industry median.
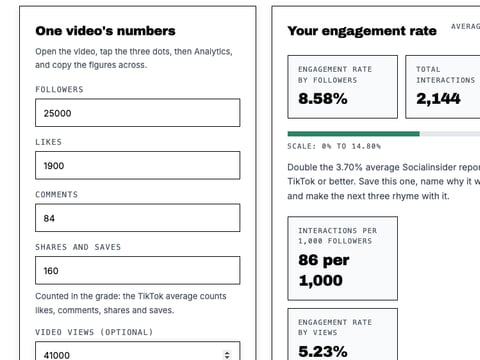
Calculate your TikTok engagement rate by followers and by views, graded against the published average.
Calculate your conversion rate, graded against the published market average, plus revenue per visitor.