 Add to Chrome
 Instagram Ad Cost Calculator (FREE TOOL)
Enter a daily budget and the days it runs to see the reach, clicks and sales it buys, split across Reels, Feed and Stories, or enter a goal to get the budget. The rates open at the 2026 medians.
- Reels (33%)
- Feed (26%)
- Stories and the rest (41%)
- Total spend
- Spend a day
- Impressions
- Clicks
- Cost per click
- Cost per sale

Built and checked by Marián Cabadaj. Last checked November 2026.
Where the numbers here come from
Triple Whale, Facebook Ad Benchmarks by Industry (Updated 2026 Data) for the CPM, CTR and conversion rate defaults and the industry menu: Meta medians, Facebook and Instagram together, August 2025 to July 2026. No first-party source publishes Instagram-only medians.
Tinuiti, Q1 2026 Digital Ads Benchmark Report for the split of Instagram ad impressions: Reels 33%, Feed 26%, and the year-on-year changes.
Instagram Help Center, Boost a post on Instagram for the daily budget and duration of a boost, its placements and the 30% Apple service fee in the iOS app.
These are other advertisers' medians, not a price from Instagram. Your own CPM, CTR and conversion rate decide your cost, so replace the defaults with your own once you have them.
The short answer
- Instagram sells ads through Meta's auction, so it has no price list of its own. Meta's 2026 medians, Facebook and Instagram together, are a $15.06 CPM, a 2.39% click-through rate and a 1.53% conversion rate (Triple Whale, 2026).
- At those medians, $30 a day for 30 days ($900) buys about 59,761 impressions, 1,428 clicks and 21.9 sales.
- Reels carried 33% of Instagram ad impressions in Q1 2026 and the Feed 26% (Tinuiti, Q1 2026). The calculator splits your impressions the same way.
- Boost from the Instagram iOS app and Apple keeps 30% of the payment. On instagram.com there is no such fee (Instagram Help Center).
Our articles are still written by HUMANS! Get human written articles in your Google feed.
Add as preferred sourceWhere does your Instagram budget go: Reels, Feed or Stories?
Instagram puts one ad in many places. Tinuiti's Q1 2026 report shows where Instagram ad impressions landed, and the calculator uses the same shares. Here is the $900 example split by placement.
Instagram ad impressions by placement, Q1 2026
| Placement | Share of impressions | Of 59,761 impressions | Where the ad shows |
|---|---|---|---|
| Reels | 33% | 19,721 | Full-screen vertical video between Reels |
| Feed | 26% | 15,538 | The home feed, between posts |
| Stories and the rest | 41% | 24,502 | Stories, Explore, profile feed and search. Tinuiti gives no share for Stories alone. |
Shares: Tinuiti, Q1 2026 Digital Ads Benchmark Report. Impressions: the $900 example above, 59,761 impressions, split by those shares. Verified 2026-11-02.
Ads built for a phone screen
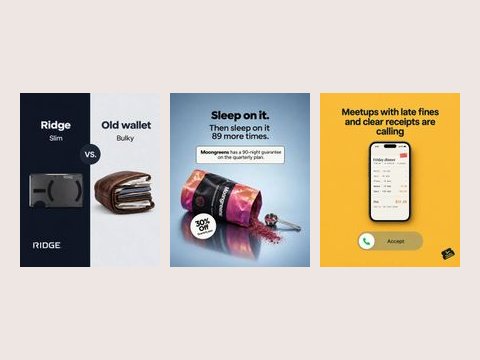
Static ads Selzee made. Each one reads at a glance on a small screen, in Stories or the Feed.
What a boost costs, and the Apple fee
A boost is a daily budget times a number of days: in the app you pick a goal, an audience, the budget you want to spend daily and the duration (Instagram Help Center). That is why this calculator asks for a daily budget and days, not a monthly total.
Boosted posts appear in Explore, Home Feed, profile feed and Stories, so a boost reaches the Feed and Stories shares in the table above.
In most regions, when you add funds in the Instagram iOS app, an Apple service fee of 30% of the total ad payment may apply, before taxes. Instagram's own advice is to boost on instagram.com to avoid it (Instagram Help Center). On a $900 boost that is $270.
How the calculator works: a worked example
The example the calculator opens with: $30 a day for 30 days at the 2026 Meta medians, a $15.06 CPM, a 2.39% CTR and a 1.53% conversion rate.
-
Spend
$30 a day x 30 days = $900.
-
Impressions and clicks
$900 / $15.06 x 1,000 = 59,761 impressions. 59,761 x 2.39% = 1,428 clicks, at $0.63 each.
-
Sales
1,428 x 1.53% = 21.9 sales, at $41.18 each.
-
Placements and the fee
Reels 33% = 19,721, Feed 26% = 15,538, the rest 41% = 24,502. Apple keeps $270 if you pay in the iOS app.
One product, one line
Sales or clicks: which goal fits your ad?
Not every Instagram ad sells. A post boosted for profile visits or website clicks is judged by its cost per click, so the calculator has a Clicks goal that needs no conversion rate.
Clicks are CPM / (1,000 x CTR) each: $0.63 at the 2026 medians. 1,000 clicks in 7 days at a $12 CPM and a 2% CTR cost $600, or $85.71 a day.
How Instagram ad prices moved in Q1 2026
Year on year, Q1 2026 against Q1 2025. More inventory came on the market, mostly through Reels, and the price per impression fell slightly.
| Change year on year | |
|---|---|
| CPM | -3% |
| Impressions | +31% |
| Spend | +28% |
Source: Tinuiti, Q1 2026 Digital Ads Benchmark Report. Tinuiti's data comes from the advertisers it manages. Verified 2026-11-02.
Why vertical ads matter for the price
About a third of Instagram ad impressions are Reels now, up from 19% a year earlier (Tinuiti, Q1 2026). A square ad still runs there, but a picture built for a tall, full screen fits the placement where most of your budget goes.
The ads below were made for a phone screen first: a lock screen, a product in hand, a face close to the camera.
Close to the camera
Live Instagram ads in Meta's Ad Library
Two ads running on Instagram, from Meta's public Ad Library. Both open with one clear line and one product.
How to lower your Instagram ad cost
Your CPM is set by the auction. Your CTR and conversion rate are set by the ad and the page. Raise the CTR and every click costs less at the same CPM; raise the conversion rate and every sale does.
For the full 2026 breakdown, with a monthly budget worked out for an apparel brand, read how much Instagram ads cost. To see an ad as it will look in the feed before you pay for it, use the Instagram ad maker. For Facebook budgets by the month, with the learning phase check, use the Facebook ads cost calculator.
Instagram ad cost calculator: FAQ
How much does it cost to advertise on Instagram?
How much does it cost to boost a post on Instagram?
How many people will see my Instagram ad for $100?
Are Instagram Reels ads cheaper than Feed ads?
Is Instagram cheaper than Facebook?
How do I avoid the Apple fee on Instagram boosts?
How much should I spend on Instagram ads per day?
How we checked
- The formulas: spend = daily budget x days; impressions = spend / CPM x 1,000; clicks = impressions x CTR; sales = clicks x conversion rate. A Clicks goal costs clicks x CPC. Placements = impressions x Tinuiti's Q1 2026 shares. The Apple fee = 30% of the payment.
- Every number on this page was worked out by hand first, then checked against the calculator's own code in 7 cases: 3 typical (a budget, a sales goal, a clicks goal), 1 boundary (one day) and 3 hostile ones (zero days, a conversion rate over 100% and a very large budget).
- The placement split is an average across the advertisers Tinuiti manages. Your own split is in Ads Manager: Breakdown, then Placement.
- Read at the source on 2 November 2026: Triple Whale, Facebook Ad Benchmarks by Industry (Updated 2026 Data), Tinuiti, Q1 2026 Digital Ads Benchmark Report and Instagram Help Center, Boost a post on Instagram.
- The two Ad Library ads were captured from Meta's public Ad Library on 2 November 2026, filtered to Instagram.
Cite this calculator
Free to cite, no attribution deal needed. A credit link back is all we ask.
Plan the budget. Let Selzee make the ads.
Selzee finds ads working right now and remakes them for your brand.
Get started for freeKeep exploring
See what a Facebook ads budget buys in impressions, clicks and sales or leads, or the budget a goal needs, from 2026 benchmarks.

Cost per thousand impressions, solved in any direction: fill any two of spend, impressions and CPM and the third is worked out.

Cost per click, plus the CTR and CPM the same three numbers already answer.
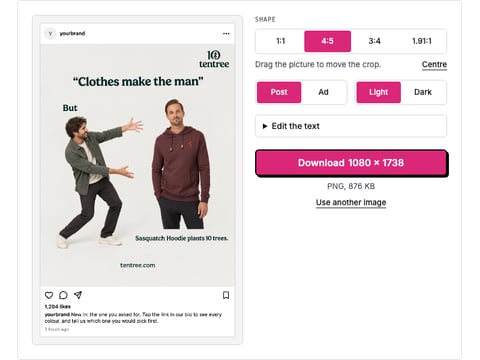
Drop a picture and get a realistic Instagram post or ad mockup: your name, caption, likes, light or dark, 1:1 or 4:5. Download a PNG. Nothing is uploaded.