
If you think a good CSAT score is the final word on your customer service performance, you're leaving money on the table. For a Shopify store with active traffic, that's a massive blind spot where revenue quietly drains away.
This guide moves past vanity metrics to forge a direct link between your support efforts and business results, like higher conversion rates and a bigger average order value (AOV). Forget generic advice; this is a practical framework for building a measurement system that tells you exactly what’s working and where to put your money for the biggest impact.
Stop Flying Blind with Basic Customer Service Metrics
Growth isn't just about making customers happy. It's about understanding precisely how every support chat and email influences your bottom line.
The ecommerce landscape is shifting. Customer service is no longer a cost center; it's a revenue engine. The global customer service software market is projected to explode from $14.9 billion to $68.19 billion by 2031. Why? Because 80% of consumers say the experience a company provides is just as important as its products.
From Vague Feelings to Hard Numbers
The single biggest mistake Shopify merchants make is treating customer service as a qualitative "feeling." You can't improve what you don't measure, and measuring the wrong things is just as bad as measuring nothing at all.
You need to make a few key mental shifts:
- Look Beyond Satisfaction: Stop asking, "Are our customers happy?" and start asking, "Did this conversation directly lead to a sale?" or "Did we solve their problem so fast they felt confident enough to add another item to their cart?"
- Tie Support Directly to Sales: Your support logs are a goldmine of data on product confusion, checkout friction, and upselling opportunities.
- Get Proactive with Measurement: Use data to spot friction points in the buying journey and fix them before they cost you a sale.
The core idea is simple: every support interaction is a potential sales conversation. By measuring the right metrics, you can systematically turn your customer service team into a high-performing growth engine, a strategy we've seen work time and again in various ecommerce case studies. This playbook will show you exactly how to build that measurement framework.
Choosing KPIs That Actually Drive Revenue
In ecommerce, not all metrics are created equal. You need to zero in on the KPIs that tell you what’s really going on with your customer relationships and, more importantly, your bottom line.
We're talking about measuring the direct financial impact of your support team.
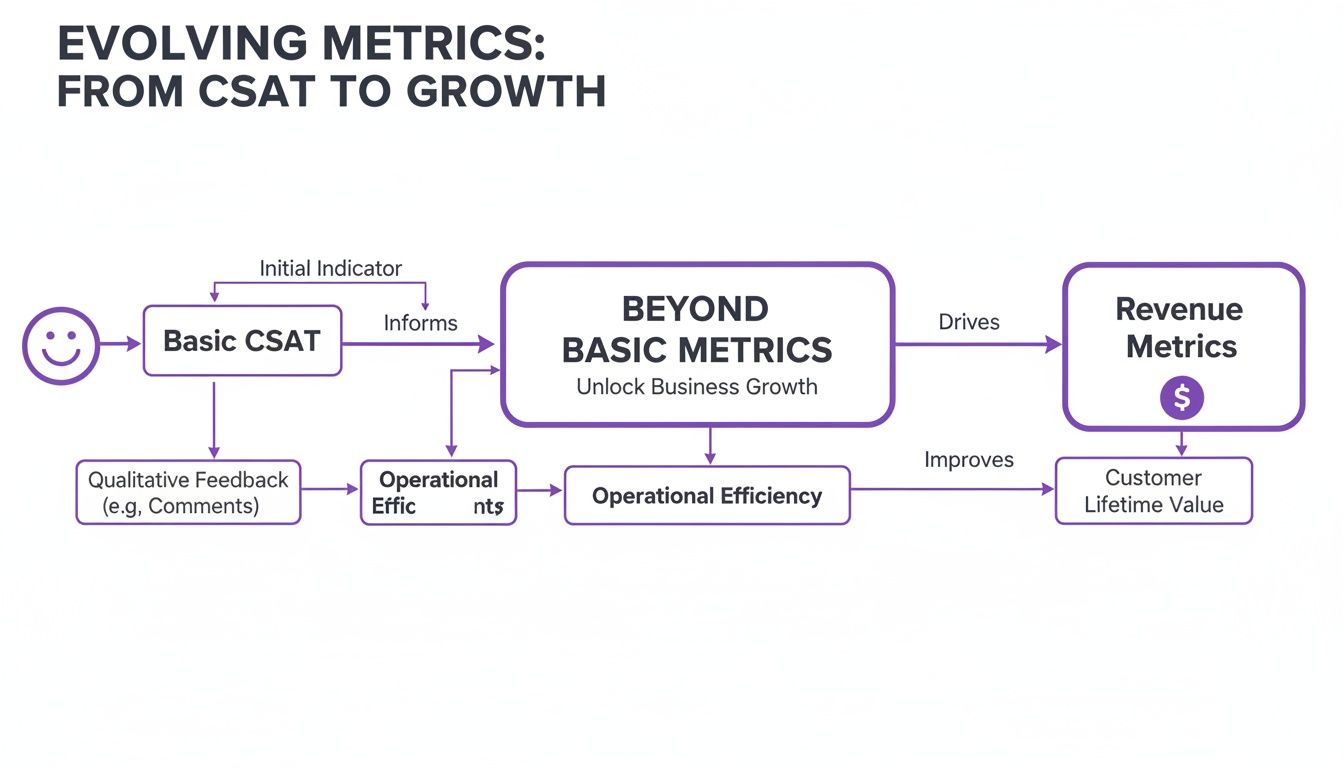
The big takeaway here? Basic satisfaction scores are a fine starting point, but real growth happens when you can draw a straight line from your support activities to revenue and long-term customer value.
Revenue-Focused Support Metrics
Let's connect support interactions directly to your Shopify store's checkout. These KPIs aren't about answering tickets faster; they're about closing sales.
Conversion Rate per Conversation: This is the heavyweight champion of support metrics. The formula is simple: track how many support chats or emails lead to a purchase within a set window. If 100 customers chat with your team and 15 of them buy something that same day, your conversion rate per conversation is 15%. This number tells you exactly how effective your team is at turning curiosity into cash. For a quick check-up, you can pop your numbers into a handy conversion rate calculator and see how you stack up.
AOV Uplift from Support: Does your support team increase cart sizes? This metric tells you. It measures the difference in Average Order Value between customers who interact with support and those who don't. If your store's typical AOV is $75, but customers who chat with your team before buying spend an average of $90, that's a $15 AOV uplift. It’s a fantastic way to see how well your team builds confidence, upsells, and cross-sells.
Efficiency and Experience Metrics
While revenue is king, customer experience is the power behind the throne. Efficiency directly influences whether a customer buys from you or bounces to a competitor.
First Response Time (FRT) is a massive conversion lever for pre-sale questions. This is the average time it takes for an agent to send the first reply. A slow response is one of the fastest ways to lose an eager customer.
Think about it: research shows that 45% of consumers expect their problem to be solved in the very first interaction. Dropping the ball here is expensive. In the US alone, businesses lose an estimated $35.3 billion annually from customers leaving due to avoidable service hiccups.
For those using automation, two key metrics are non-negotiable for ensuring your AI assistant is pulling its weight.
AI-Only Resolution Rate: What percentage of customer chats are fully handled by your AI without a human ever stepping in? A high rate means your AI is crushing common questions, freeing up your human agents for high-value conversations.
Human Escalation Rate: On the flip side, what percentage of AI conversations get passed to a human? If this number creeps up, it’s a red flag. It could mean a new product issue has surfaced or there's a gap in your AI's knowledge base that needs to be fixed, stat.
Setting Up Your Data Sources the Right Way
KPIs are wishful thinking without clean, reliable data. Setting up your data sources properly isn’t a technical chore—it's the foundation of your entire measurement strategy. Get this part wrong, and you're making decisions based on noise, not signal.
The goal is to stitch together a coherent view of the customer's journey, connecting support interactions to sales data.
Instrumenting Your Shopify Store
The fastest way to get a pulse on customer happiness is through surveys. Don't overcomplicate this. You can start collecting CSAT, NPS, or CES data right now.
- Post-Chat Surveys: Use a Shopify app or your helpdesk's built-in feature to pop up a one-question survey the instant a chat ends for immediate feedback.
- Post-Purchase Email Automations: In a tool like Klaviyo, set up an email that goes out a few days after an order arrives. Ask the NPS question: "How likely are you to recommend us to a friend?"
The biggest mistake merchants make is tracking these scores in a vacuum. A CSAT score of 85% is a vanity metric if you can't see how it impacts your repeat purchase rate or customer lifetime value.
Unifying Your Data Streams
Your most powerful "aha!" moments will come from blending data from different sources. This is how you stop guessing and start knowing what moves the needle on revenue.
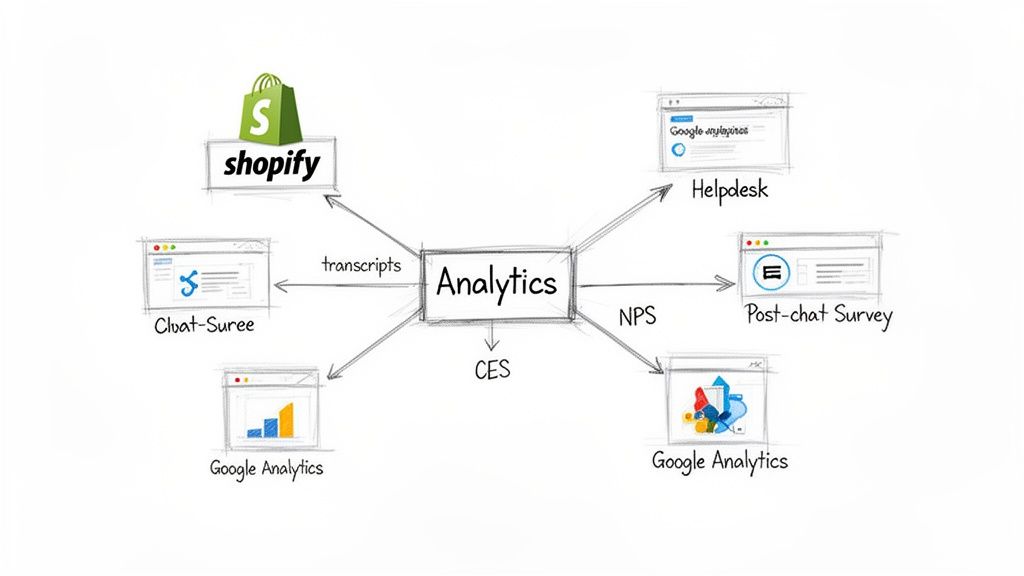
Your helpdesk or AI chat tool can't be a silo; it has to talk to your analytics platforms. This integration is what lets you trace the full story: a customer lands on your site, browses a product, asks your AI assistant a sizing question, and then immediately completes the purchase.
For instance, when you connect an AI assistant like Selzee to your Shopify Analytics and Google Analytics, you can finally trace sales directly back to specific support conversations. You can definitively answer, "How much revenue did our customer service generate last month?" This is how you transform your support team from a cost center into a documented profit driver.
Your chat transcripts are a goldmine. Dig deeper than keyword searches. Modern tools can run sentiment analysis automatically, flagging recurring frustrations that might point to a confusing product description, a tricky shipping policy, or a hidden bug in your checkout. These are silent conversion killers, and by wiring up your data sources correctly, you can expose and fix them.
Using AI to Automate and Supercharge Measurement
Manually tracking customer service performance doesn't scale. This is where AI flips the script, turning measurement from a reactive chore into a real-time, predictive growth engine.
AI tools can dive into 100% of your customer conversations—every chat, every ticket—and instantly analyze them for sentiment, intent, and trends. This is physically impossible for a human team. It means you can spot a spike in complaints about a new product line or identify a confusing shipping policy in hours, not weeks.
And customers are ready for it. 79% of consumers are now comfortable using generative AI for support. By 2025, 60% of service firms are expected to lean on analytics to go beyond traditional surveys. Case studies are already reporting 94% AI-only resolution rates, proving this tech is far beyond the "early adopter" phase.
From Manual Tagging to Actionable Intelligence
Imagine your AI assistant acting as a business intelligence partner. It can instantly tag conversations with labels like "sizing issue," "shipping delay," or "hot lead," giving you a live dashboard of what your customers actually care about.
This is what that looks like in practice. The AI doesn't just talk; it listens, understands, and acts.
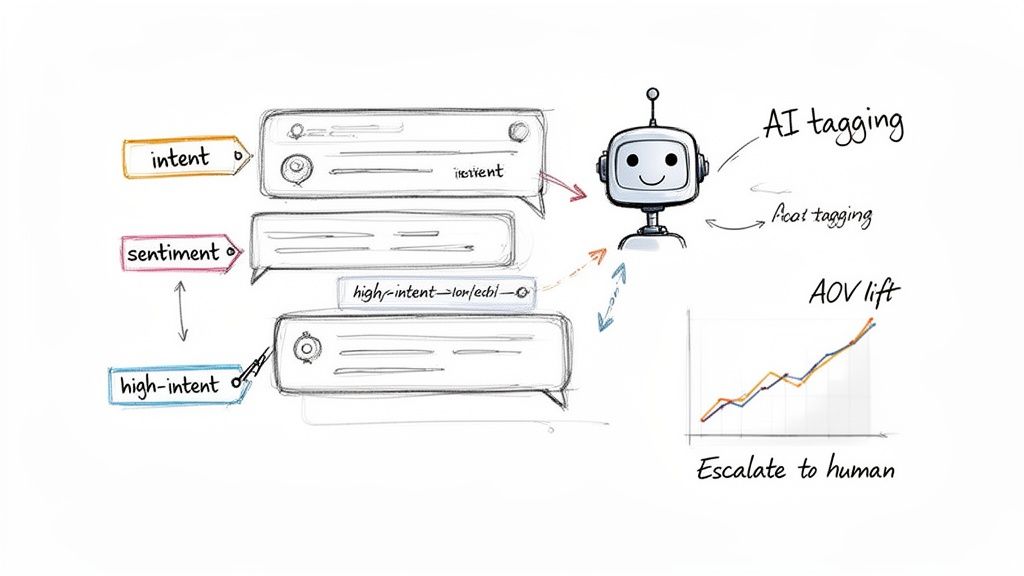
With this level of automation, you’re not just deflecting tickets. You’re actively identifying high-intent shoppers, spotting trends that feed back into your marketing, and finding UX friction points on your website.
Tying AI Performance Directly to Revenue
The best AI platforms don't make you work for the insights. They come with built-in analytics that eliminate the guesswork. Forget spending hours trying to cross-reference helpdesk data with Shopify sales reports; you get a clean, direct view of your ROI.
The Mistake That Costs Money: Treating your AI chatbot as just a ticket-deflection machine. The real value is using its data to generate revenue. If your AI tool can't show you exactly how many sales it influenced or how much it lifted AOV, you're missing the point.
This is exactly what platforms like Selzee are built for. They automatically track the revenue metrics that matter, with zero complex setup:
- Revenue Generated by AI: A clear dollar amount showing exactly what the AI brought in.
- AOV Lift: A direct comparison of order values between customers who chatted with the AI and those who didn't.
- AI-Only Resolution Rate: The percentage of issues solved without a human ever touching the ticket, proving its efficiency.
Of course, to trust the data, you need to know the AI is performing reliably. That's where continuous AI observability and monitoring becomes critical. It ensures the data driving your decisions is accurate. By picking the right AI-powered tools, you transform customer service from a cost center into a documented, high-performing sales channel.
Building Dashboards That Turn Insights Into Action
Raw data is useless. A great customer service dashboard is your command center, helping you spot trends and pounce on opportunities long before your competition.
Forget overwhelming reports. An effective dashboard is about curated insights, tailored for different people on your team. The goal is a single source of truth that everyone can understand in a heartbeat, whether for a high-level daily check-in or a weekly deep dive.
Designing Your Performance Dashboard
The secret to a dashboard people actually use is structure. A simple way to organize it is by how often you’ll look at it.
The Daily Pulse (Your 60-Second Check-in): Sits at the top and gives you the essentials: total conversation volume, yesterday’s CSAT, and any big jumps in AI escalation rates. It's designed to tell you if the house is on fire.
The Weekly Deep Dive (Your Tactical Review): This is where you zoom out and look at trends over the last seven days. It’s the perfect spot for your revenue-focused metrics like Conversion Rate per Conversation and AOV Uplift. You’re not just staring at numbers; you're hunting for patterns. Did that flash sale cause a spike in pre-sale questions? Did the new product launch bomb your CES score?
Your dashboard's job isn't just to report numbers; it's to spark action. A high Customer Effort Score (CES) tied to returns is a blaring alarm telling you to fix your returns process, immediately.
From Analysis to Actionable Experiments
Your dashboard is the starting point for a powerful feedback loop: Analyze, hypothesize, experiment, and measure. This is the rhythm that systematically improves performance.
Here’s a real-world example. Your dashboard shows a ton of pre-sale questions about shipping times, but the Conversion Rate per Conversation for these chats is low.
The Hypothesis: Customers are getting cold feet because our shipping info is vague. The answers they're getting don't give them the confidence to buy.
The Experiment: You program your AI assistant, like Selzee, to instantly provide a dynamic, location-based delivery estimate in the chat window the moment shipping-related keywords appear.
The Measurement: For the next two weeks, you obsessively track the Conversion Rate per Conversation for chats that triggered this new AI response. You compare it against your baseline. If the conversion rate jumped, you’ve just found a direct, measurable link between a specific customer service tweak and more sales. That’s how you win.
Ready, Set, Measure: Your Action Plan
Enough theory. Let's turn talk into results. This is your playbook for transforming customer service measurement into a revenue-generating machine.
The biggest mistake is trying to boil the ocean and ending up with analysis paralysis. For the next 30 days, pick just two or three KPIs and obsess over them. This laser focus is what creates real change.
Your First 30-Day Measurement Sprint
Think of this as a mini-project with a huge payoff. We're going to build a simple but powerful feedback loop for quick wins.
Here’s the game plan:
- Pick Your Power-Duo: Grab one efficiency metric and one revenue metric. A great starting combo is First Response Time (FRT) and Conversion Rate per Conversation. This pair immediately connects how fast you are to how much you sell.
- Grab Your Gear: You don't need a complex tech stack. A simple survey app from the Shopify App Store and your helpdesk’s built-in reporting are perfect starting points. If you already have an AI assistant like Selzee, its native revenue tracking is ready to roll.
- Build a Scrappy Dashboard: A basic Google Sheet is your best friend. Create columns for your KPIs, track them daily, and add a "notes" column to log what you're testing—like a new proactive chat message.
This first sprint isn't about perfection. It's about building momentum and getting the team into the habit of seeing how their work directly impacts the bottom line.
If you’re running on Shopify and want to go even deeper on platform-specific strategies, this comprehensive guide on how to measure customer service for Shopify brands is an excellent next read.
The point is to create a rhythm. After 30 days, review what you’ve learned. Did dropping your FRT by 20% nudge conversions up? Great. Lock in those changes. If not, swap out FRT for Customer Effort Score (CES) and start a new sprint. This constant cycle of testing, learning, and iterating is how you build a system that uncovers new ways to drive growth.
Frequently Asked Questions
Putting this into practice always brings up a few more questions. Here are the most common ones from Shopify merchants.
How Often Should I Be Looking at My Customer Service Metrics?
Don't look at everything all the time. You'll burn out.
Daily Pulse Checks: High-velocity numbers like First Response Time (FRT) and AI Escalation Rate are your daily check-ins. A sudden jump in either is a red flag for a broken promo code, a checkout bug, or another fire you need to put out, fast.
Weekly Trend Analysis: This is where you zoom out. KPIs like Conversion Rate per Conversation and AOV Uplift are perfect for a weekly review. This gives you enough data to see real trends without getting whiplash from daily fluctuations.
What’s a “Good” CSAT Score for a Shopify Store?
Industry benchmarks float around 75% to 85%, but chasing a universal average is a trap. The number that matters most is your own trendline.
Is your score ticking up, month after month? That’s what matters. Also, segment your data. You might find your post-purchase support has a 90% CSAT, but pre-sale questions are pulling your average down. That is an actionable insight.
Can I Measure Support Performance Without Expensive Tools?
Absolutely. The most expensive mistake isn't buying a tool; it's waiting for the "perfect" setup and measuring nothing in the meantime. Start simple, prove the value, and then invest in more advanced platforms.
Here’s a quick-start stack that won’t break the bank:
- Surveys: Grab a free or low-cost Shopify app to send simple CSAT or NPS surveys after a purchase or a closed support ticket.
- Tracking: Use a Google Sheet. Manually logging KPIs forces you to really look at the numbers.
- Analytics: Dig into the reports you already have. Your helpdesk and Google Analytics are treasure troves for connecting support chats to on-site behavior and sales.
This approach builds the muscle memory for data-driven decisions. Once you can show a clear ROI, getting the budget for a more automated tool becomes a no-brainer.
How Do I Know if My AI Chatbot Is Actually Helping?
It's about more than deflecting tickets. A great AI assistant is a sales engine. Three metrics tell the real story:
- AI-Only Resolution Rate: What percentage of chats does the AI handle from start to finish? This is your core efficiency metric.
- Conversion Rate per AI Conversation: Are people who chat with the AI actually buying? This is the ultimate proof of value.
- Emerging Trend Identification: Your AI should be your early-warning system, spotting and tagging new customer questions or complaints before they become widespread problems.
If your AI tool doesn't give you clear analytics on these fronts, it's just a fancy FAQ page—not a growth tool.
For merchants who want a quick summary, here’s a fast-action plan to get started.
Quick Guide to Implementing Customer Service Metrics
This table breaks down the essentials for getting your measurement strategy off the ground quickly.
| Step | Action | Tool/Method Suggestion |
|---|---|---|
| 1. Define a Goal | Pick one core objective to start. Example: "Increase conversion from support chats." | Whiteboard session, team meeting |
| 2. Select 2-3 KPIs | Choose metrics directly tied to your goal. Ex: CSAT, Conversion per Conversation. | Your helpdesk analytics, Google Analytics |
| 3. Instrument Data | Set up simple surveys and tracking. | Shopify survey app, Google Sheets |
| 4. Establish Baseline | Run it for 2-4 weeks to find your starting point. Don't change anything yet. | Manual tracking in your Google Sheet |
| 5. Build a Dashboard | Create a simple, visual way to see your KPIs at a glance. | Google Data Studio, a dedicated tab in your tracking sheet |
| 6. Analyze & Iterate | Hold a weekly review to discuss trends and plan one small experiment. | Weekly 30-minute team huddle |
By following these steps, you build a solid foundation for a data-driven customer service operation that actively contributes to your store's growth.
Turning customer conversations into revenue is the endgame. A powerful AI shopping assistant automates this by giving shoppers instant answers and smart recommendations that naturally boost conversion and AOV. With an assistant like Selzee, you get built-in analytics that prove the direct financial impact of your customer service—finally transforming support from a cost center into a documented profit driver. See how it works at selzee.com.