
As a Shopify merchant, you know "good" customer service isn't a vague feeling. It's a set of hard numbers that directly impacts your bottom line. The most critical customer service KPIs (Key Performance Indicators) for any ecommerce brand are First Contact Resolution (FCR), Customer Satisfaction (CSAT), and Average Handle Time (AHT). Why these three? Because they directly predict revenue, conversions, and the loyalty that keeps customers spending.
Stop Guessing and Start Measuring What Matters
If you're running a live Shopify store, you get it. Every click, chat, and support ticket is a fork in the road. One path leads to a loyal fan, the other sends them straight to your competitor. Vague feelings about "happy customers" don't pay the bills. The only way to transform customer service from a cost center into a growth engine is by tracking the right data.
This guide cuts through the noise of vanity metrics. We'll zero in on the high-impact customer service KPIs that tell you exactly what’s working and what’s burning a hole in your budget. Think of these metrics as your store's vital signs—they're your early warning system for trouble and your roadmap to hidden growth.
Why Standard KPIs Fall Short for Ecommerce
Generic business advice doesn't cut it for Shopify merchants. Your support team isn't just closing tickets; they are your front-line sales force, directly influencing buying decisions in real-time. The KPIs you track must connect their performance to tangible financial outcomes.
Here’s what you should be asking to see real results:
- Conversion Impact: How does a lightning-fast, accurate answer to a pre-sale question affect your conversion rate?
- Cart Abandonment: Are support hiccups causing shoppers to abandon their carts? Which questions signal a customer is about to leave?
- Customer Lifetime Value (CLV): How does a great support experience lead to more repeat purchases and a higher average order value (AOV)?
By connecting support metrics to sales data, you stop measuring busy work and start measuring business growth. This is the fundamental shift from reactive support to proactive sales.
Understanding these connections is critical. A low First Contact Resolution rate, for instance, isn't just an efficiency problem; it’s a direct source of pre-purchase friction and lost sales. A dip in your Customer Satisfaction score post-delivery could signal issues with your fulfillment partner or misleading product descriptions—not just a reflection on your support agents.
Consider this guide your blueprint for tracking the customer service KPIs that genuinely matter for your store. You'll get the formulas, learn where to find the data, and walk away with actionable strategies to move the needle on every metric. It's time to turn every customer interaction into a revenue opportunity.
Boost Conversions with First Contact Resolution
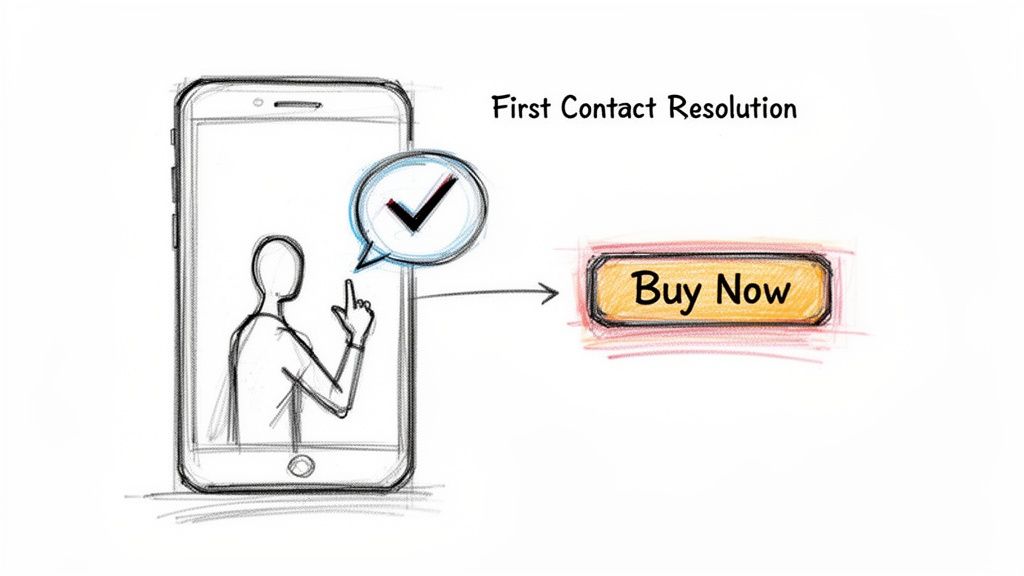
Stop thinking of First Contact Resolution (FCR) as just another support metric. For your Shopify store, it’s a conversion driver. FCR is the percentage of customer questions you solve in a single interaction—no follow-ups, no transfers, no frustrating "let me get back to you."
Every time a potential customer has to pause their shopping to wait for an answer about sizing or shipping, their buying momentum stalls. A high FCR rate means you’re eliminating that hesitation on the spot, turning a simple question into a confident click on the 'Buy Now' button. This isn't just about providing good service; it's about closing sales before a shopper gets distracted or has second thoughts.
Calculating Your First Contact Resolution
The formula for FCR is straightforward. Most modern helpdesks and AI chat tools, including Selzee, handle this math for you automatically in their analytics dashboards.
(Total Number of Issues Resolved in One Contact / Total Number of Issues Received) x 100 = FCR Rate (%)
If you handled 200 support chats last month and 160 were resolved without needing a follow-up, your FCR rate is 80%. This customer service KPI gives you a clear picture of your support efficiency.
Industry benchmarks hover around 70-75%, but top-tier performers push that to 85% or higher by leveraging AI and solid knowledge bases. For Shopify merchants, this metric is gold because an unresolved question often leads directly to an abandoned cart. For instance, Selzee's AI shopping assistant hits an impressive 94% AI-only resolution rate, turning chats into sales without human handoff. Discover more insights about customer service statistics on salesmate.io.
Why Your FCR Rate Is Suffering (and Costing You Money)
A low FCR rate is a red flag that something is creating friction for your customers. It's rarely your support agents' fault. It’s usually a symptom of deeper site issues forcing customers to seek basic information.
Here are the usual suspects for Shopify stores:
- Vague Product Descriptions: If customers constantly ask about materials, dimensions, or compatibility, your product pages are failing. Your support chat shouldn't double as a missing spec sheet.
- Unclear Policies: Ambiguity around shipping times, costs, or returns is a major source of pre-purchase anxiety and support tickets.
- Hidden Information: Is your FAQ buried in the footer? Are contact options hard to find? Making information inaccessible guarantees more support contacts.
- Poor Agent Training or Tools: Your team can't solve problems on the first try if they lack the right information or authority.
Actionable Steps to Improve FCR Immediately
Boosting your FCR doesn't require a massive overhaul. It’s about a targeted approach to eliminating customer uncertainty at the source.
First, dig into your support logs and identify the top 3-5 questions your team answers repeatedly. This is your high-priority hit list. Next, attack the root cause. If sizing is a constant issue, create a detailed, visual sizing guide and place a prominent link on every apparel page.
If questions about product features are clogging your inbox, it's time to improve your copy. Vague descriptions kill conversions. Using a free product description tool can help you write clearer, more persuasive text that answers questions before they're asked. By proactively fixing these points of confusion, you’re not just improving a key customer service KPI—you’re directly smoothing the path to purchase.
Drive Repeat Business with Customer Satisfaction
Customer Satisfaction (CSAT) is the real-time pulse of customer loyalty. While many metrics focus on speed, CSAT gets to the heart of what matters most for your Shopify store: how happy a customer is after interacting with you. A great score isn't a vanity metric; it's a clear sign of customers who are eager to buy again.
It’s also an incredible diagnostic tool. A pattern of low scores is an early warning system, flagging hidden issues long before they cost you serious revenue. That dip in satisfaction might not be a support problem—it could be a red flag pointing to a faulty product, a buggy checkout, or a broken shipping promise.
How to Measure CSAT Without Annoying Customers
Measuring CSAT is about timing and simplicity. You ask one direct question right after a support interaction: "How satisfied were you with the help you received?" Most stores use a simple 1-5 or 1-10 scale.
(Number of "Satisfied" Responses / Total Number of Survey Responses) x 100 = CSAT Score (%)
"Satisfied" typically means anyone who gave a 4 or 5 on a 5-point scale. The key is to make responding effortless. A one-click survey in the chat window or at the bottom of a support email gets far more responses than a link to another page.
Timing is everything. Don't spam everyone. Trigger surveys at key moments:
- Right after a live chat or AI conversation ends. This gives you immediate, raw feedback.
- A few days after an order is delivered. This captures feelings about the entire experience, from purchase to unboxing.
Turning Feedback into Actionable Insights
A high CSAT score is great, but the real value is hidden in the feedback behind low scores. Analyzing that feedback provides a data-driven roadmap for improving your entire business. See a dip? Dig in. Is it tied to a specific product line? Does it only happen with evening support requests?
It's no surprise that 31% of business leaders consider CSAT their number one customer experience metric. They know it's welded to repeat business. A whopping 88% of customers are more likely to buy again after a positive service experience. When your CSAT is consistently above 80%, you’re doing more than providing good support—you’re laying the groundwork for sustainable growth. A great way to capitalize on this is to actively work to increase Customer Lifetime Value.
Common Causes of Low CSAT Scores (and Lost Revenue)
Bad CSAT scores rarely appear out of nowhere. They almost always point to a specific snag in the customer journey. For Shopify merchants, the usual suspects are:
- Product Mismatches: The item looks nothing like the pictures, or the quality feels cheaper than described. This shatters trust instantly.
- Shipping Surprises: Unexpected delays, high shipping costs revealed at final checkout, or a crushed box on arrival can ruin a perfect purchase.
- Unresolved Issues: The customer leaves the conversation feeling their problem wasn't really solved, even if you marked the ticket "closed."
By tagging and categorizing feedback, you can spot these patterns before they become disasters. If you notice low scores mentioning a new beauty product causing skin irritation, investigate the formula or add a clear warning to the product page. This is how you transform CSAT from a simple score into a powerful engine for improving your entire business.
Make Your Support Team an Efficiency Machine
Efficiency isn’t just about speed. It’s about getting back your time and money. As a Shopify merchant, every minute your support team spends on a repetitive question is a minute they could have spent on a high-stakes conversation that turns a curious shopper into a loyal customer.
Tracking efficiency means working smarter, not harder.
The goal is to find bottlenecks in your support process. We need to see where your team—or your AI—is missing information to free up your human agents for the tricky, high-value chats that build relationships and drive sales. This transforms your support from a cost center into a sales engine.
Average Handle Time (AHT): The Double-Edged Sword
Average Handle Time (AHT) is the classic efficiency metric. It tracks the total time spent on a customer interaction, from start to finish, including talk, hold, and follow-up work.
(Total Talk Time + Total Hold Time + Total Follow-Up Time) / Total Number of Interactions = AHT
If an agent spends 500 minutes on calls, 50 minutes on hold, and 100 minutes on follow-up tasks across 100 tickets, the AHT is 6.5 minutes.
But here's the trap: chasing a rock-bottom AHT can be a disaster. It encourages agents to rush people, give incomplete answers, and tank your customer satisfaction scores. A low AHT is useless if it creates more follow-up tickets and angry shoppers.
The goal isn't just a low AHT; it's an optimized AHT. Stop asking, "How fast can we close this ticket?" and start asking, "How quickly can we give a complete, correct answer that prevents another ticket?"
This is where a sharp AI assistant changes the game. Selzee can resolve repetitive questions like "Where's my order?" in seconds, crushing the AHT for common issues. This frees up your human team to spend more quality time on complex conversations, like helping a customer decide between two expensive products. That conversation will have a higher AHT but will be far more profitable.
Tickets Solved Per Hour: Your True Productivity Gauge
While AHT focuses on a single interaction, Tickets Solved per Hour provides a bigger picture of your team's overall productivity. It's a no-nonsense metric that shows how much work is getting done.
The math is simple:
- Total number of tickets resolved by an agent in a day / Total hours worked that day = Tickets Solved Per Hour
This KPI is great for gauging team capacity and spotting top performers. It also highlights agents who might be struggling. If someone's solved ticket count is consistently low, they may need better training, easier access to information, or clearer escalation protocols.
But like AHT, this number needs context. An agent handling complex technical issues will naturally solve fewer tickets per hour than someone resetting passwords.
To make this KPI useful, segment the data. Look at Tickets Solved Per Hour based on:
- Ticket Type: Compare performance on "shipping questions" versus "technical issues."
- Channel: Is your team faster on live chat or email?
- Time of Day: Are you understaffed during the evening rush?
Digging into these trends reveals where your operation is efficient and where it's struggling. If your team has trouble resolving questions about a new product, it’s a huge sign that your product pages are missing key details. In this case, using a tool to optimize your product name or write better descriptions can slash ticket volume and boost team efficiency. Improving information at the source empowers both your AI and human agents to solve tickets faster and better.
Build Your Actionable KPI Dashboard
Raw data is useless. A spreadsheet of response times and satisfaction scores won't grow your business. But an actionable dashboard transforms those cold numbers into a command center for your operation.
Think of it as your single source of truth, showing the health of your customer experience at a glance.
The magic happens when you stop collecting data and start connecting it. A great dashboard tells a story, linking different customer service KPIs to reveal the bigger picture. It’s not about cramming every metric onto one screen—it’s about strategically pairing them to find those "aha!" moments.
Designing Your Dashboard for Daily, Weekly, and Monthly Wins
Your dashboard shouldn't be one-size-fits-all. Different metrics require different levels of attention. Structure your view based on how often you need to act on the data.
Here’s a practical breakdown:
Daily Huddle View (5-Minute Pulse Check): This is for immediate, frontline action. You’re looking at real-time metrics like Open Ticket Volume and First Response Time (FRT). A sudden spike is your early warning system—perhaps a site glitch or a confusing marketing campaign—letting you react in minutes, not days.
Weekly Check-In View (Strategy & Performance): Now you're looking at trends. Track First Contact Resolution (FCR) and Tickets Solved per Agent. Is FCR trending down? This could signal that your team needs more training on a new product. This view is perfect for managing team performance and spotting problems before they snowball.
Monthly Strategy View (The Big Picture): Time to zoom out. Focus on Customer Satisfaction (CSAT) and Ticket Volume by Topic. A month-over-month drop in CSAT is a serious red flag. Analyzing the topics driving the most tickets gives you a clear roadmap for which product pages or policies need an overhaul.
Curious how Selzee pulls all of this into one clean, actionable view? You can schedule a quick demo to see it in action.
Connecting the Dots for Deeper Insights
The true power of a dashboard is unlocked when you start pairing metrics. Looking at one KPI in isolation can be misleading. For instance, a fantastic FCR rate means nothing if your CSAT score is tanking. That combination screams that your team is closing tickets fast but leaving a trail of unhappy customers.
This visual shows how the core pieces of support efficiency fit together—handle time, solved tickets, and quality are all interconnected.
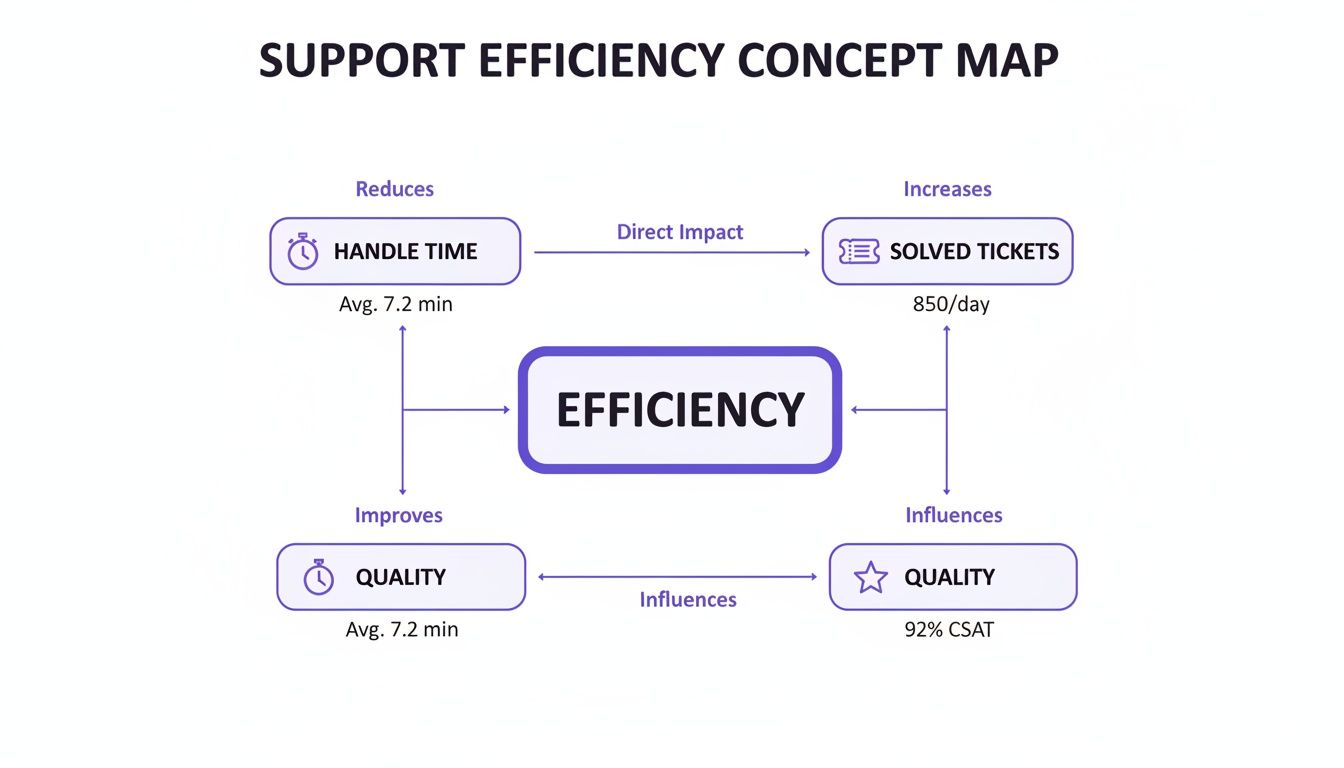
It makes it clear that real efficiency isn't just about speed (handle time) or volume (solved tickets). It’s about nailing both while keeping quality high.
Your dashboard should be built to answer one critical question: "Are we solving customer problems effectively and leaving them happy?" Pairing FCR with CSAT answers this head-on.
Ultimately, your dashboard is more than a reporting tool—it’s your decision-making engine. It empowers you to stop reacting to fires and start proactively building a better customer experience that fuels loyalty and drives revenue. When you pull data from Shopify, your helpdesk, and your AI platform into one unified view, you get the clarity needed to make smart, fast decisions that move the needle.
Turn Your KPI Insights Into Revenue
So you’ve got your customer service KPIs. Great. But knowing your numbers is worthless until you use them to make money. This is where we stop looking at data and start using it to boost your bottom line.
We’re going to turn those CSAT scores, FCR rates, and handle times into a real-world playbook for increasing revenue. Data is just numbers until you connect it to profitable action. Your KPIs are signals, constantly telling you what’s working and what’s quietly draining your bank account.
From Low FCR to a High-Converting Sales Funnel
A dropping First Contact Resolution (FCR) rate isn't just a support problem; it's a giant sign pointing to a crack in your sales funnel. A low FCR means shoppers are hitting roadblocks, and your site isn't providing the answers they need to complete a purchase.
Instead of just telling your agents to "resolve tickets faster," use that FCR data like a detective. Dive into your support logs and find the patterns.
The Symptom: You're swamped with questions about product materials or dimensions.
The Diagnosis: Your product descriptions are failing to sell the product.
The Fix: Rewrite your copy. Vague descriptions breed hesitation, and hesitation kills sales. Your live chat shouldn't have to function as a product page. Use our generator to craft clear, benefit-driven text that anticipates and answers questions before a customer asks.
The Symptom: Your inbox is full of chats about shipping times or your return policy.
The Diagnosis: Your most important policies are confusing or buried on your site.
The Fix: Build a crystal-clear, easy-to-read FAQ page and link it everywhere—in your header, on your product pages, and in your footer. An AI-powered assistant can serve up these answers instantly, turning a potential support ticket into a confident, completed purchase.
Turning CSAT Dips into Stronger Product Pages
A sudden dip in your Customer Satisfaction (CSAT) score is a goldmine of opportunity. When you see those scores drop, resist blaming a single bad support interaction. Look deeper. Is the low score tied to one specific product? Does it consistently happen right after delivery?
A low CSAT score is often a customer screaming, "This isn't what I expected!" The problem didn't start with the support ticket; it started on your product page.
This feedback is your optimization roadmap. If customers complain that a product is smaller than they imagined, add lifestyle photos showing it in use for scale. If they're confused about its main features, your description is failing.
This is the perfect chance to beef up your on-page communication. Use a free bullet points tool to spotlight the most important benefits right under the product title, making them impossible to miss. It's a simple change that adds clarity, builds trust, and slashes the post-purchase disappointment that kills CSAT scores. Every piece of negative feedback is a free lesson in how to sell better. For a deeper look at how these tweaks affect sales, check out our guide on calculating your store's conversion rate.
When you systematically connect your KPI data to real-world site improvements, you create a powerful feedback loop. You’re not just putting out fires; you're fireproofing your entire customer journey. This is how you transform raw data into a smoother path to purchase, more confident buyers, and ultimately, more revenue.
Got Questions About KPIs? We've Got Answers.
Here are the most common questions from Shopify merchants trying to master customer service metrics.
"I'm a new Shopify store owner. Which single KPI should I obsess over?"
If you're just starting, your North Star should be First Contact Resolution (FCR). Hands down.
When a potential customer on your site has a pre-purchase question, that's your moment to shine. Getting them a complete, accurate answer on the first try can be the tipping point between a sale and a lost customer. Nail your FCR, and you'll build immediate trust and turn early shoppers into paying customers.
"How often should I even be looking at these numbers?"
It depends on the metric and your traffic volume.
For day-to-day operational metrics like FCR and ticket volume, a daily or weekly pulse check is best. This helps you spot problems before they snowball. For bigger picture satisfaction metrics like CSAT, a weekly or monthly review is perfect for spotting trends. The key is consistency—make checking your KPIs a regular business habit.
"Do I need to shell out for expensive software to track all this?"
No, not at all. While many helpdesks and AI chat tools have great built-in analytics, you can get started without them.
You can begin by manually pulling data from your support email or chat logs into a simple spreadsheet. It’s more hands-on, but it's a fantastic way to get a feel for your performance before you invest in more powerful tools.
At Selzee, we believe support conversations should do more than solve problems—they should drive sales. Our AI Shopping Assistant is built to improve the KPIs that grow your business, turning questions into sales and first-time shoppers into lifelong fans.